Student's Name:劉同學 (02110704017)
Date of Essay:2018-08-10
【Task 1 Topic】
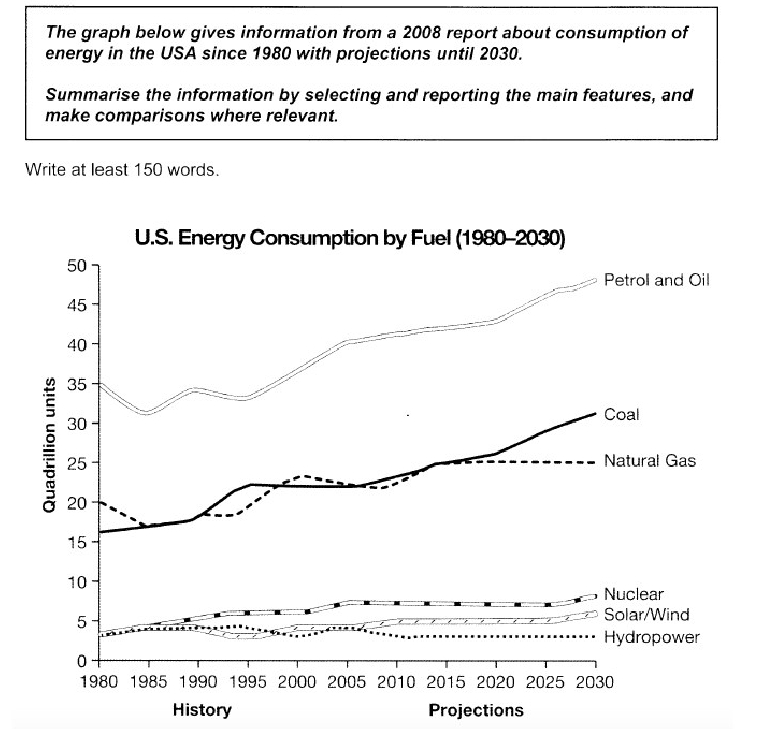
The graph below gives information from a 2008 report about consumption of energy in the USA since 1980 with a projections until 2030.
Summarise the information by selecting and reporting the main features, and make comparisons where relevant.
======STUDNET'S ANSWER AS BELOW =======
This graph chart illustrates the variations of six sorts of energy, namely petrol and oil, coal, natural gas, nuclear, solar/wind and hydropower, which used in America from 1980 and makes a prediction (What is the subject of this? Energy sources cannot make predictions!) until 2030.In general, the consumption of petrol and oil topped the chart from 1980, and it will be remained the largest group in 2030, according to the projection of this graph.
The quadrillion units of petrol and oil was 35 from 1980, and after 2005, the consumption was steadily increased steadily. In 2030, the use of fuels will reach 50 quadrillion units. The consumption of coal and natural gas was slightly fluctuated slightly from 1980 to 2010, then which reveled a continuous ascension(not clear) after 2015, while natural gas used to (?) keep the same proportion.
The use of nuclear, solar/wind and hydropower was were merely about 4 quadrillion units from 1980. After 1985, the use of nuclear power demonstrated a slightly riese to approximately 7 quadrillion units, it will be projected to remain the same proportion in 2025. From this graph, the consumption of nuclear, solar/wind and hydropower were the least important which with each proportion reported to will be 7,5 and 3 respectively in 2030.
=======MARK AS BELOW ========
【總分說明】
You list statistics without comparing and contrasting.
Task: 4.5 Coherence, cohesion: 5 Lexical: 5 Grammatical range/accuracy: 4.5
Score: 5.0
【為什麼這位同學獲得5分?怎麼評比的】
IELTS Mock Test Writing Assessment (Task 1)
Date: ________ /________/________
Candidate Name: ____劉同學____________
Candidate Number: ____(02110704017) _____
|
Criteria |
Score |
Comments |
|
Task Achievement
|
4.5 |
You have your paraphrasing and overview highlighting the highest energy consumption throughout the period. Might be worth mentioning half of the energy sources remain steadily low while the other three see an upward trend.
|
|
Coherence & Cohesion |
5 |
There is some organisation. You group your information adequately, however there is not enough linking to present much clearer progression.
|
|
Lexical Resource |
5 |
Adequate, but somewhat limited vocabulary. Do not rely too much on only VERBS: increase, fluctuate, decrease… to describe the line graph.
|
|
Grammatical Range & Accuracy |
4.5 |
You attempt at using more complex structures, however they tend to contain grammatical mistakes. Fortunately, most mistakes do not reduce communication.
|
|
Total Score for Task 1 |
5.0 |
|